
SEO
Core Web Vitals in 2026: Operational Workflow Over Score Chasing
A practical Core Web Vitals guide for frontend teams covering LCP, CLS, INP, media payloads, responsive layouts, and deployment validation.
Core Web Vitals in 2026: Operational Workflow Over Score Chasing
A practical Core Web Vitals guide for frontend teams covering LCP, CLS, INP, media payloads, responsive layouts, and deployment validation.
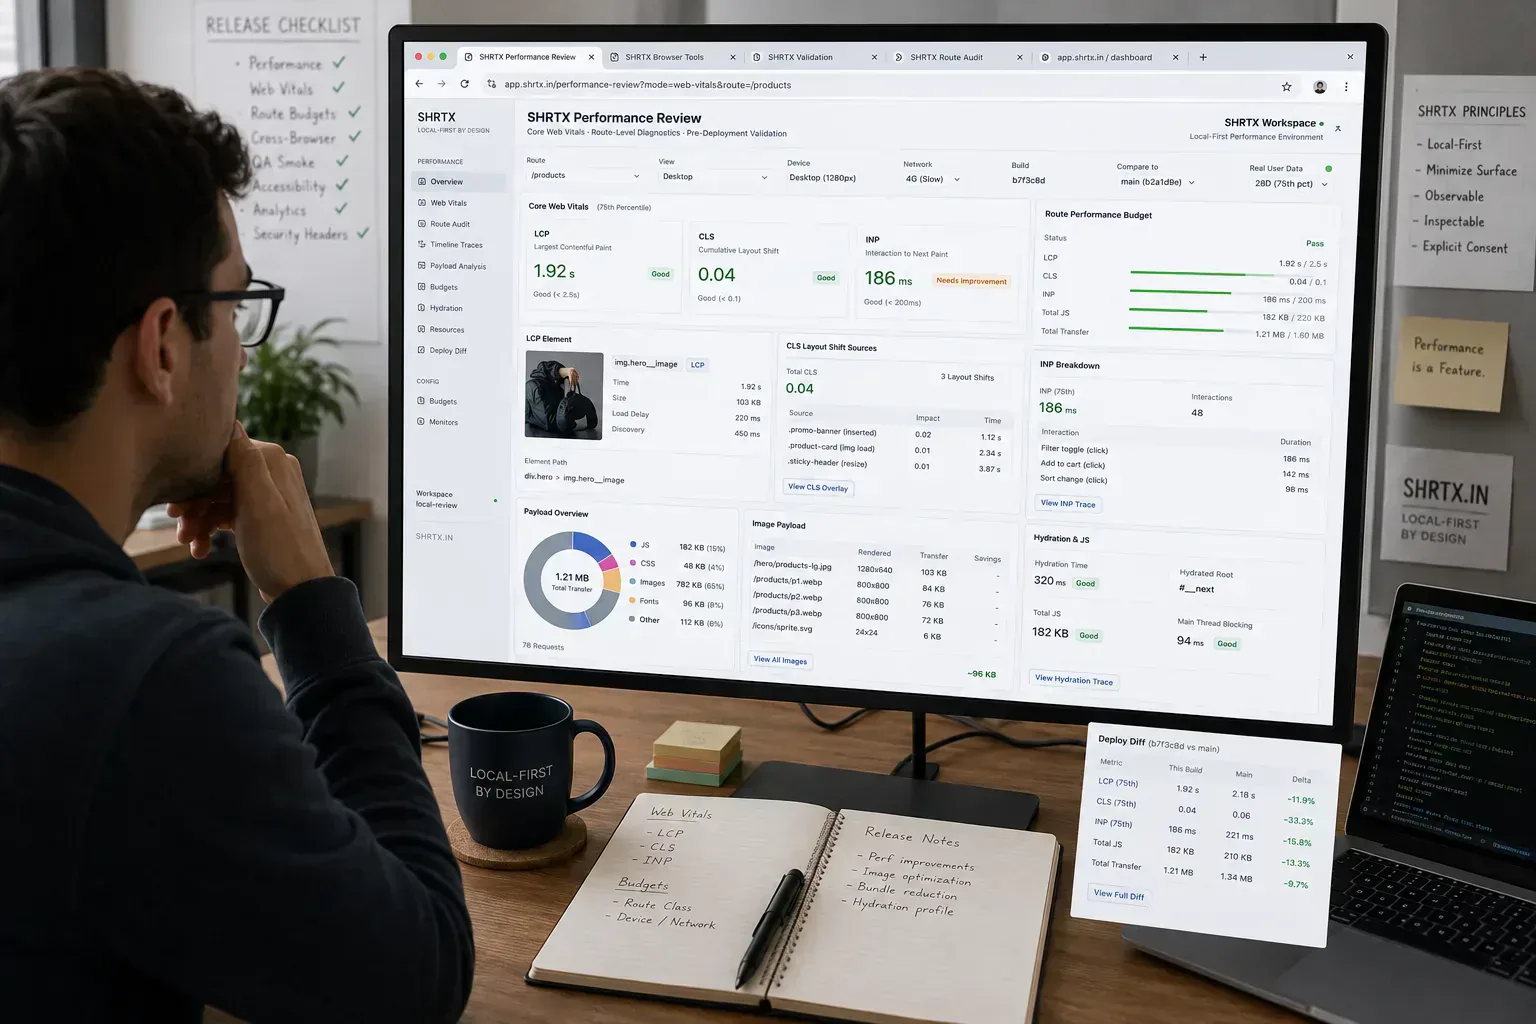
Core Web Vitals work usually starts under release pressure. A staging page passes review on desktop, then production picks up a heavier CMS image, a consent banner, a cached analytics tag, or a hydration delay from real user data. The report says LCP, CLS, or INP moved, but the team still has to find the template, asset, component, or rollout step that caused it.
Performance review belongs close to release operations because the cause is often split across systems. Lighthouse may point at the symptom, the browser trace may show the blocking task, and the deployment diff may reveal a renderer change that looked harmless in code review. The useful question is where the page started doing extra work.
Quick Answer
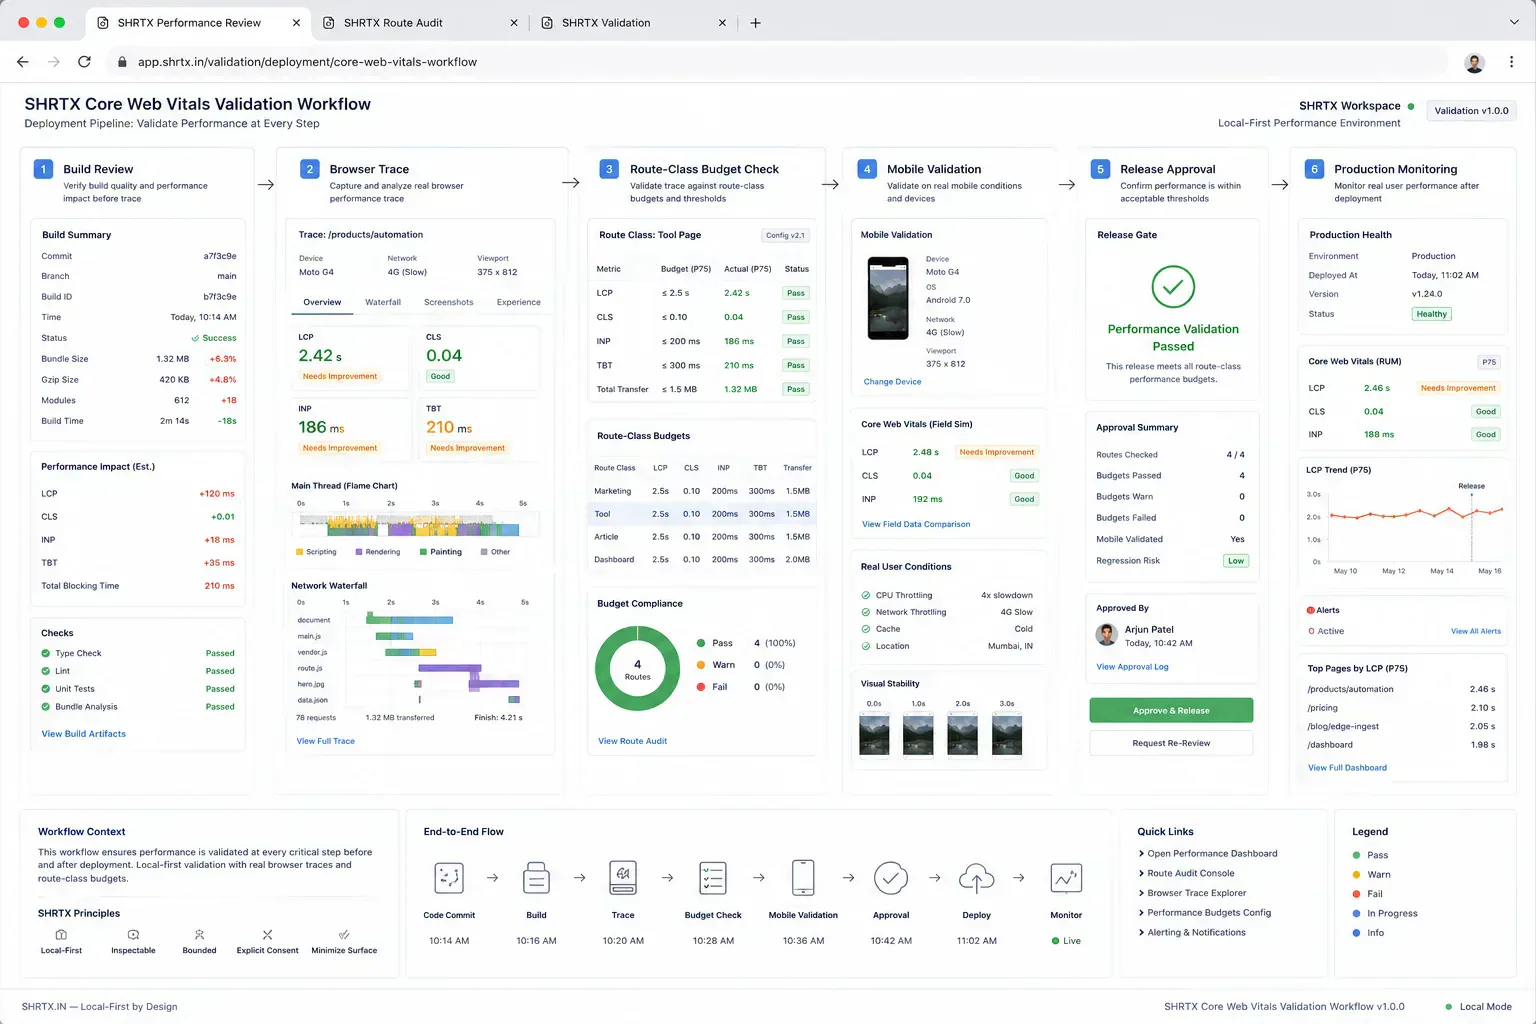
Core Web Vitals audits are strongest when they tie each metric to a route class, rendering path, asset source, and release owner. Treat the score as a signal, then inspect the browser behavior that produced it.
Start With Route Classes
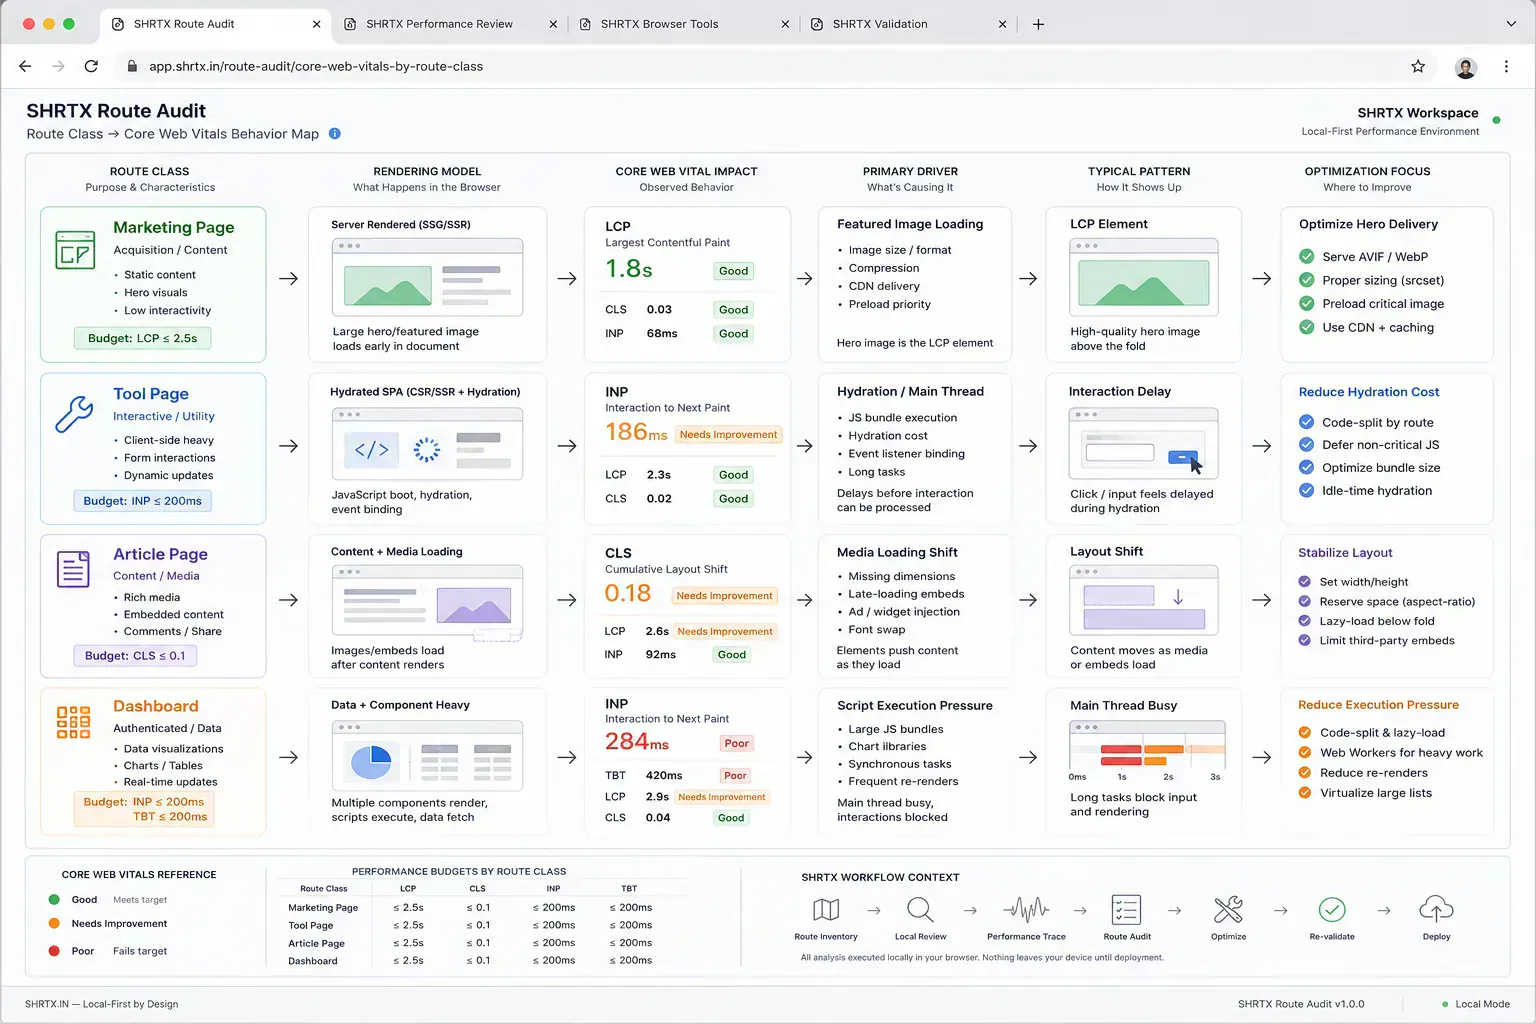
A marketing page, article, utility tool, dashboard, and media guide fail performance budgets in different ways. LCP on an article may be the featured image, while LCP on a tool page may be the primary input panel. INP on a browser utility often points to local parsing, image work, or validation that begins while the user is still interacting.
Group routes before tuning individual pages. Otherwise a team fixes one report, leaves the shared renderer unchanged, and watches the same regression return through another slug. Route classes also make cache and device inconsistencies easier to compare because the same component families appear in every release diff.
Compare The Review Paths
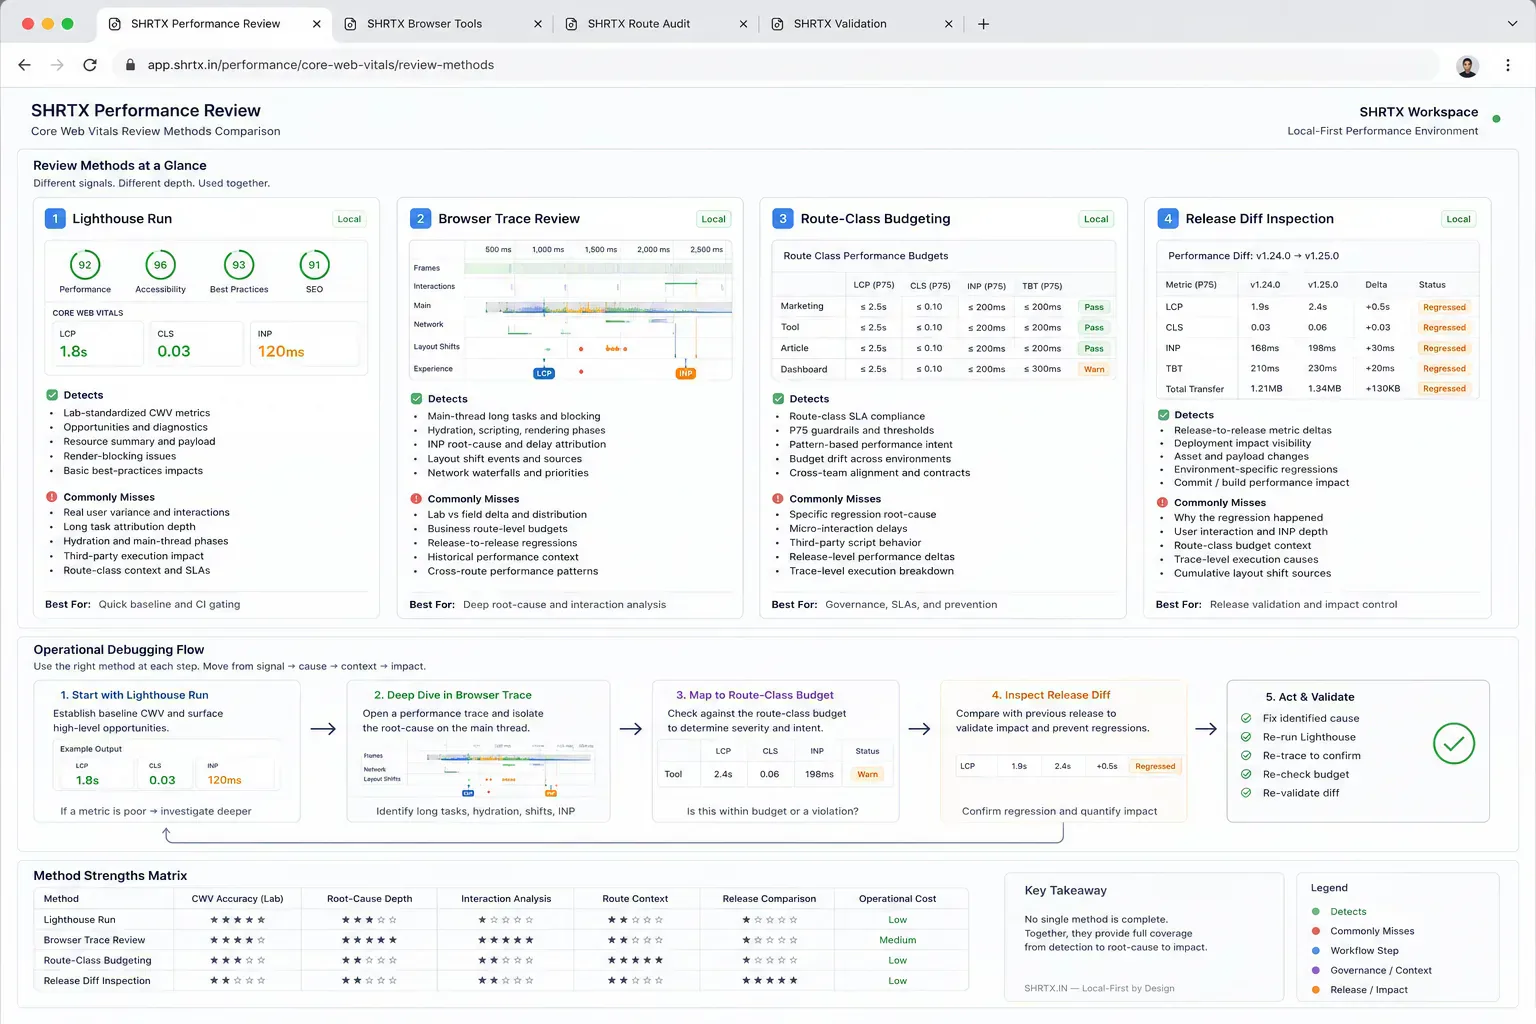
| Review Path | What It Catches | What It Often Misses |
|---|---|---|
| Single Lighthouse run | Lab LCP, CLS, INP warnings on one URL | Template drift, cache effects, and route-class patterns |
| Route-class budget | Repeated regressions across articles, tools, or hubs | Field issues from cache state, geography, or device class |
| Browser trace review | Main-thread blocking, hydration, script timing, and paint order | Long-term field distribution unless paired with analytics |
| Release diff inspection | New scripts, heavier images, shifted components, and layout contracts | Old debt that predates the current rollout |
Media Regressions Start Before Deployment
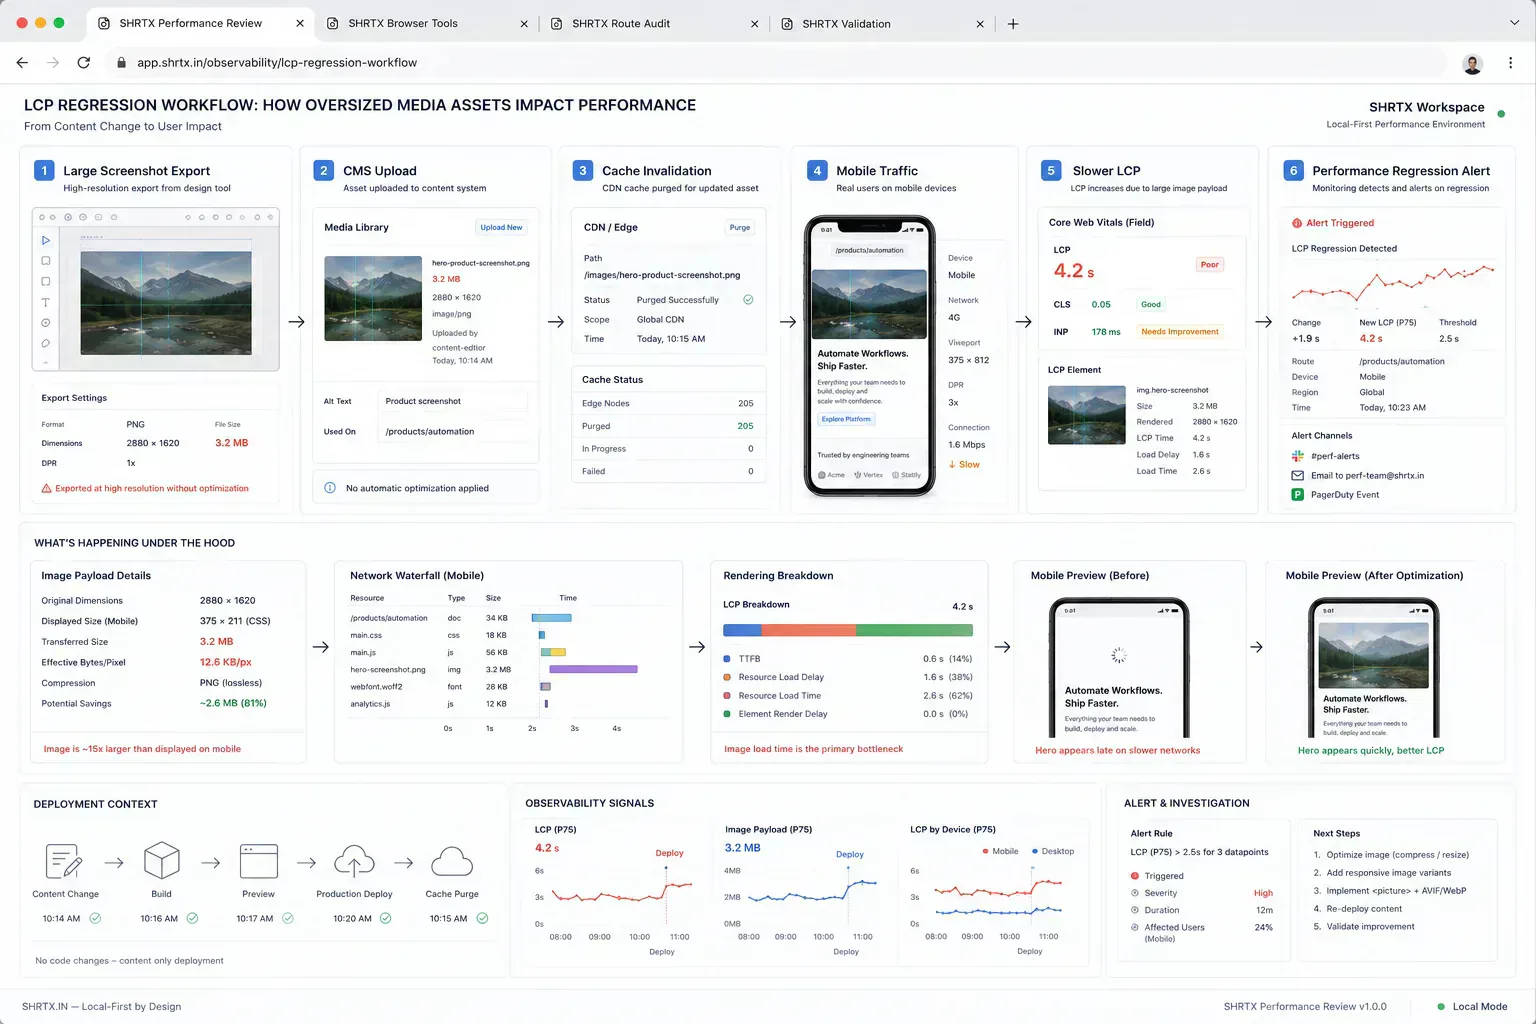
Large screenshots, dashboard exports, decorative backgrounds, and uncompressed PNGs still create many LCP regressions. The fix starts before the CMS accepts the asset. A rushed editor may upload a 3 MB staging screenshot because the page looks fine on office Wi-Fi, then mobile traffic exposes the real cost after cache invalidation.
Use Image Dimension Checker to verify display needs, Image Compressor to reduce payload, Image to WebP Converter for suitable formats, and File Size Analyzer to compare batches before publishing. This keeps media preparation local and deterministic before the asset reaches the slower review chain.
Instrument The Browser, Not Only The Report
Field data is useful, but frontend teams also need browser-side visibility while reproducing a regression. Staging may use different cookies, fewer third-party scripts, edge caching inconsistencies, and warmer assets than production. A small local snippet can mark route-class timing and show whether hydration or interaction setup is drifting between the two.
const routeClass = document.body.dataset.routeClass || "unknown"

new PerformanceObserver((list) => {
  for (const entry of list.getEntries()) {
    console.table({
      routeClass,
      metric: entry.entryType,
      name: entry.name,
      start: Math.round(entry.startTime),
      duration: Math.round(entry.duration || 0)
    })
  }
}).observe({ type: "largest-contentful-paint", buffered: true })
Keep this kind of helper temporary, scoped, and removed before it becomes ambient telemetry. It gives the reviewer a browser-native checkpoint during deployment review. When a route class changes, the trace can be compared with the component diff and asset list.
CLS Comes From Missing Contracts
Layout shift usually means the page did not reserve space for something it knew would appear. Images, cards, ads, embeds, client-rendered modules, and alert banners need stable dimensions. A visual review in a wide desktop viewport will not catch the mobile shift caused by a late cookie banner or a longer translated label.
For interface-heavy pages, define responsive constraints near the component that owns the space. A bento grid, dashboard module, or tool panel should not rely on loaded text, icons, or late client state to decide its footprint. The browser needs a contract before content arrives.
INP Exposes Runtime Placement
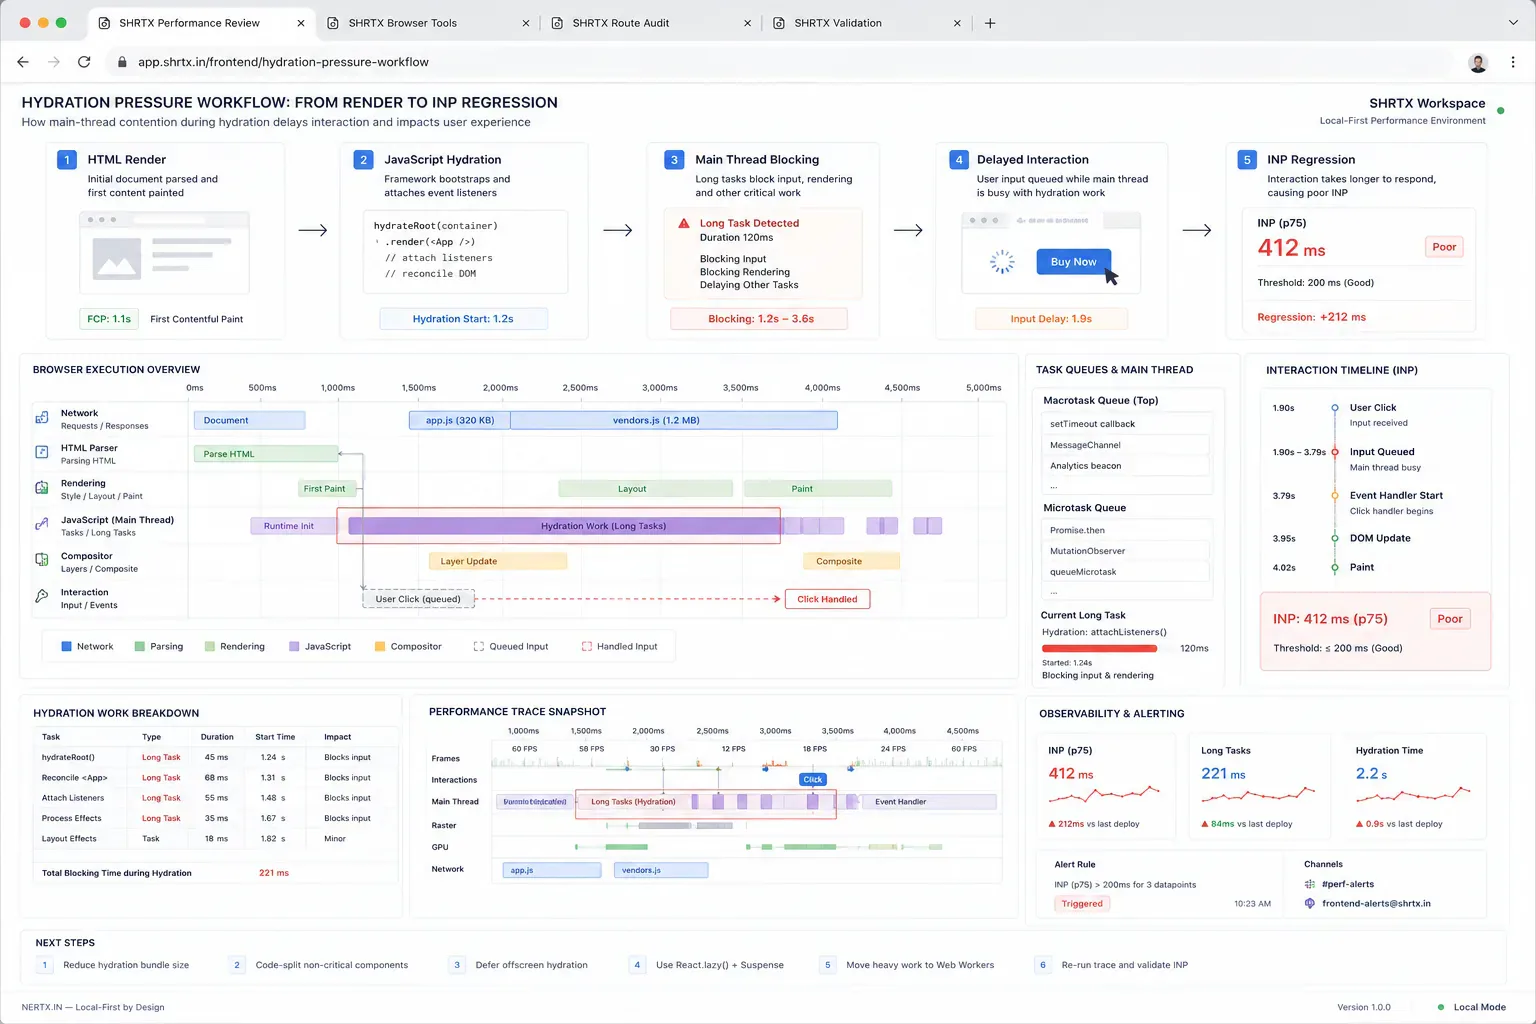
Interaction delay is often a sign that work landed on the main thread at the wrong time. Image processing, JSON parsing, schema validation, table filtering, and large React state updates can all compete with input handling. This is especially visible in browser-native tools where local processing is part of the product.
Local execution is still the right placement for many SHRTX workflows. The implementation needs workers, progressive feedback, dynamic imports, and early validation so the browser can keep responding while it processes real artifacts. A local tool that blocks input during a large file parse has moved the privacy boundary correctly but still needs runtime discipline.
Score Chasing Leaves The Cause Behind
Teams often optimize the test page while leaving the publishing workflow unchanged. They compress one hero image, defer one script, or hide one unstable block. Two releases later, the same failure returns through a new template because the asset rule, component contract, or script approval path never changed.
The better review records route class, LCP candidate, image payload, responsive dimensions, script additions, interaction-heavy modules, and remaining risk. Keep the note short. The next person should understand what changed without replaying the whole audit from screenshots and Slack messages.
Region-specific third-party latency belongs in that note when it affects production but not staging. Otherwise the same analytics, consent, or embed delay gets misread as a component regression during the next rollout.
Final Takeaway
Core Web Vitals work becomes useful when the metric leads back to the implementation path. Route classes, asset preparation, browser traces, and component contracts make performance review repeatable. The score can move for many reasons, but the release process should make the cause inspectable.
Tools Referenced By Topic
Related Reading
Jan 31, 2026 • 5 min
Decoding Redirect Chains in Technical SEO Workflows
A practical guide to finding and fixing redirect chains, loops, canonical drift, crawl budget waste, and deployment routing mistakes in modern web systems.
Mar 11, 2026 • 6 min
Auditing Internal Link Equity in Workflow-Heavy Websites
A practical guide to internal link audits for utility platforms, content hubs, tool ecosystems, anchor text, orphan pages, and search discovery.
Feb 21, 2026 • 6 min
Semantic HTML Workflows Beyond Heading Tags
A practical SEO and accessibility guide to semantic HTML structure, landmarks, content hierarchy, schema alignment, and frontend rendering discipline.